Valuable Learnings from Private Preview
In September, we finished our “Private Preview” testing period with close to 50 highly skilled testers. Their feedback was very promising - and immensely valuable.
In late June 2022, HUB Ocean entered a three-month private preview phase, where partners, friends, and scientists were invited to test out some key capabilities in the Ocean Data platform, to gather feedback and proceed with the rest of our roadmap.

Graham Moore
“During the Private Preview, we received a lot of valuable feedback from our participants. We were excited to have scientists, data scientists, and industrial users from different backgrounds test our platform’s functionality and capabilities technically and provide us with feedback that will contribute to the continuous development of the Ocean Data Platform,” said Graham Moore, Chief Data and Product Officer in HUB Ocean.

Cera McTavis
“Our findings from the feedback gathered, reveal that majority of our testers attest to the platform being useful, easy to use, and efficient for the pain points they experience in their various fields, with the predominant pain point being - access and easy analysis of data,” said Cera McTavish, Community Growth Manager in HUB Ocean
Immediate use in the current research study

Physicist and post-doc fellow Jorge Rodriguez, from the Spanish Research Council (CSIC), was one of our testers. During his interview walkthrough after his test period, Jorge told us how useful the platform is to his current research study.
He was working on an analysis of shipping traffic in the Arctic due to the changes in the Arctic as a result of climate change and its influence on the marine environment.
“Having access to this kind of data was a very good opportunity for us to update our analysis” -said Rodriguez.
He worked with the AIS shipping data in the Ocean Data Connector, using the Jupyter notebooks and Python code to quantify the shipping routes for the highest and lowest traffic. Typically understanding how these shipping routes progress through the different seasons (If they are getting thicker or broader etc) and how long they last. Through the Ocean Data Connector, he was able to quickly analyze these vast amounts of shipping traffic data easily to get some insights.
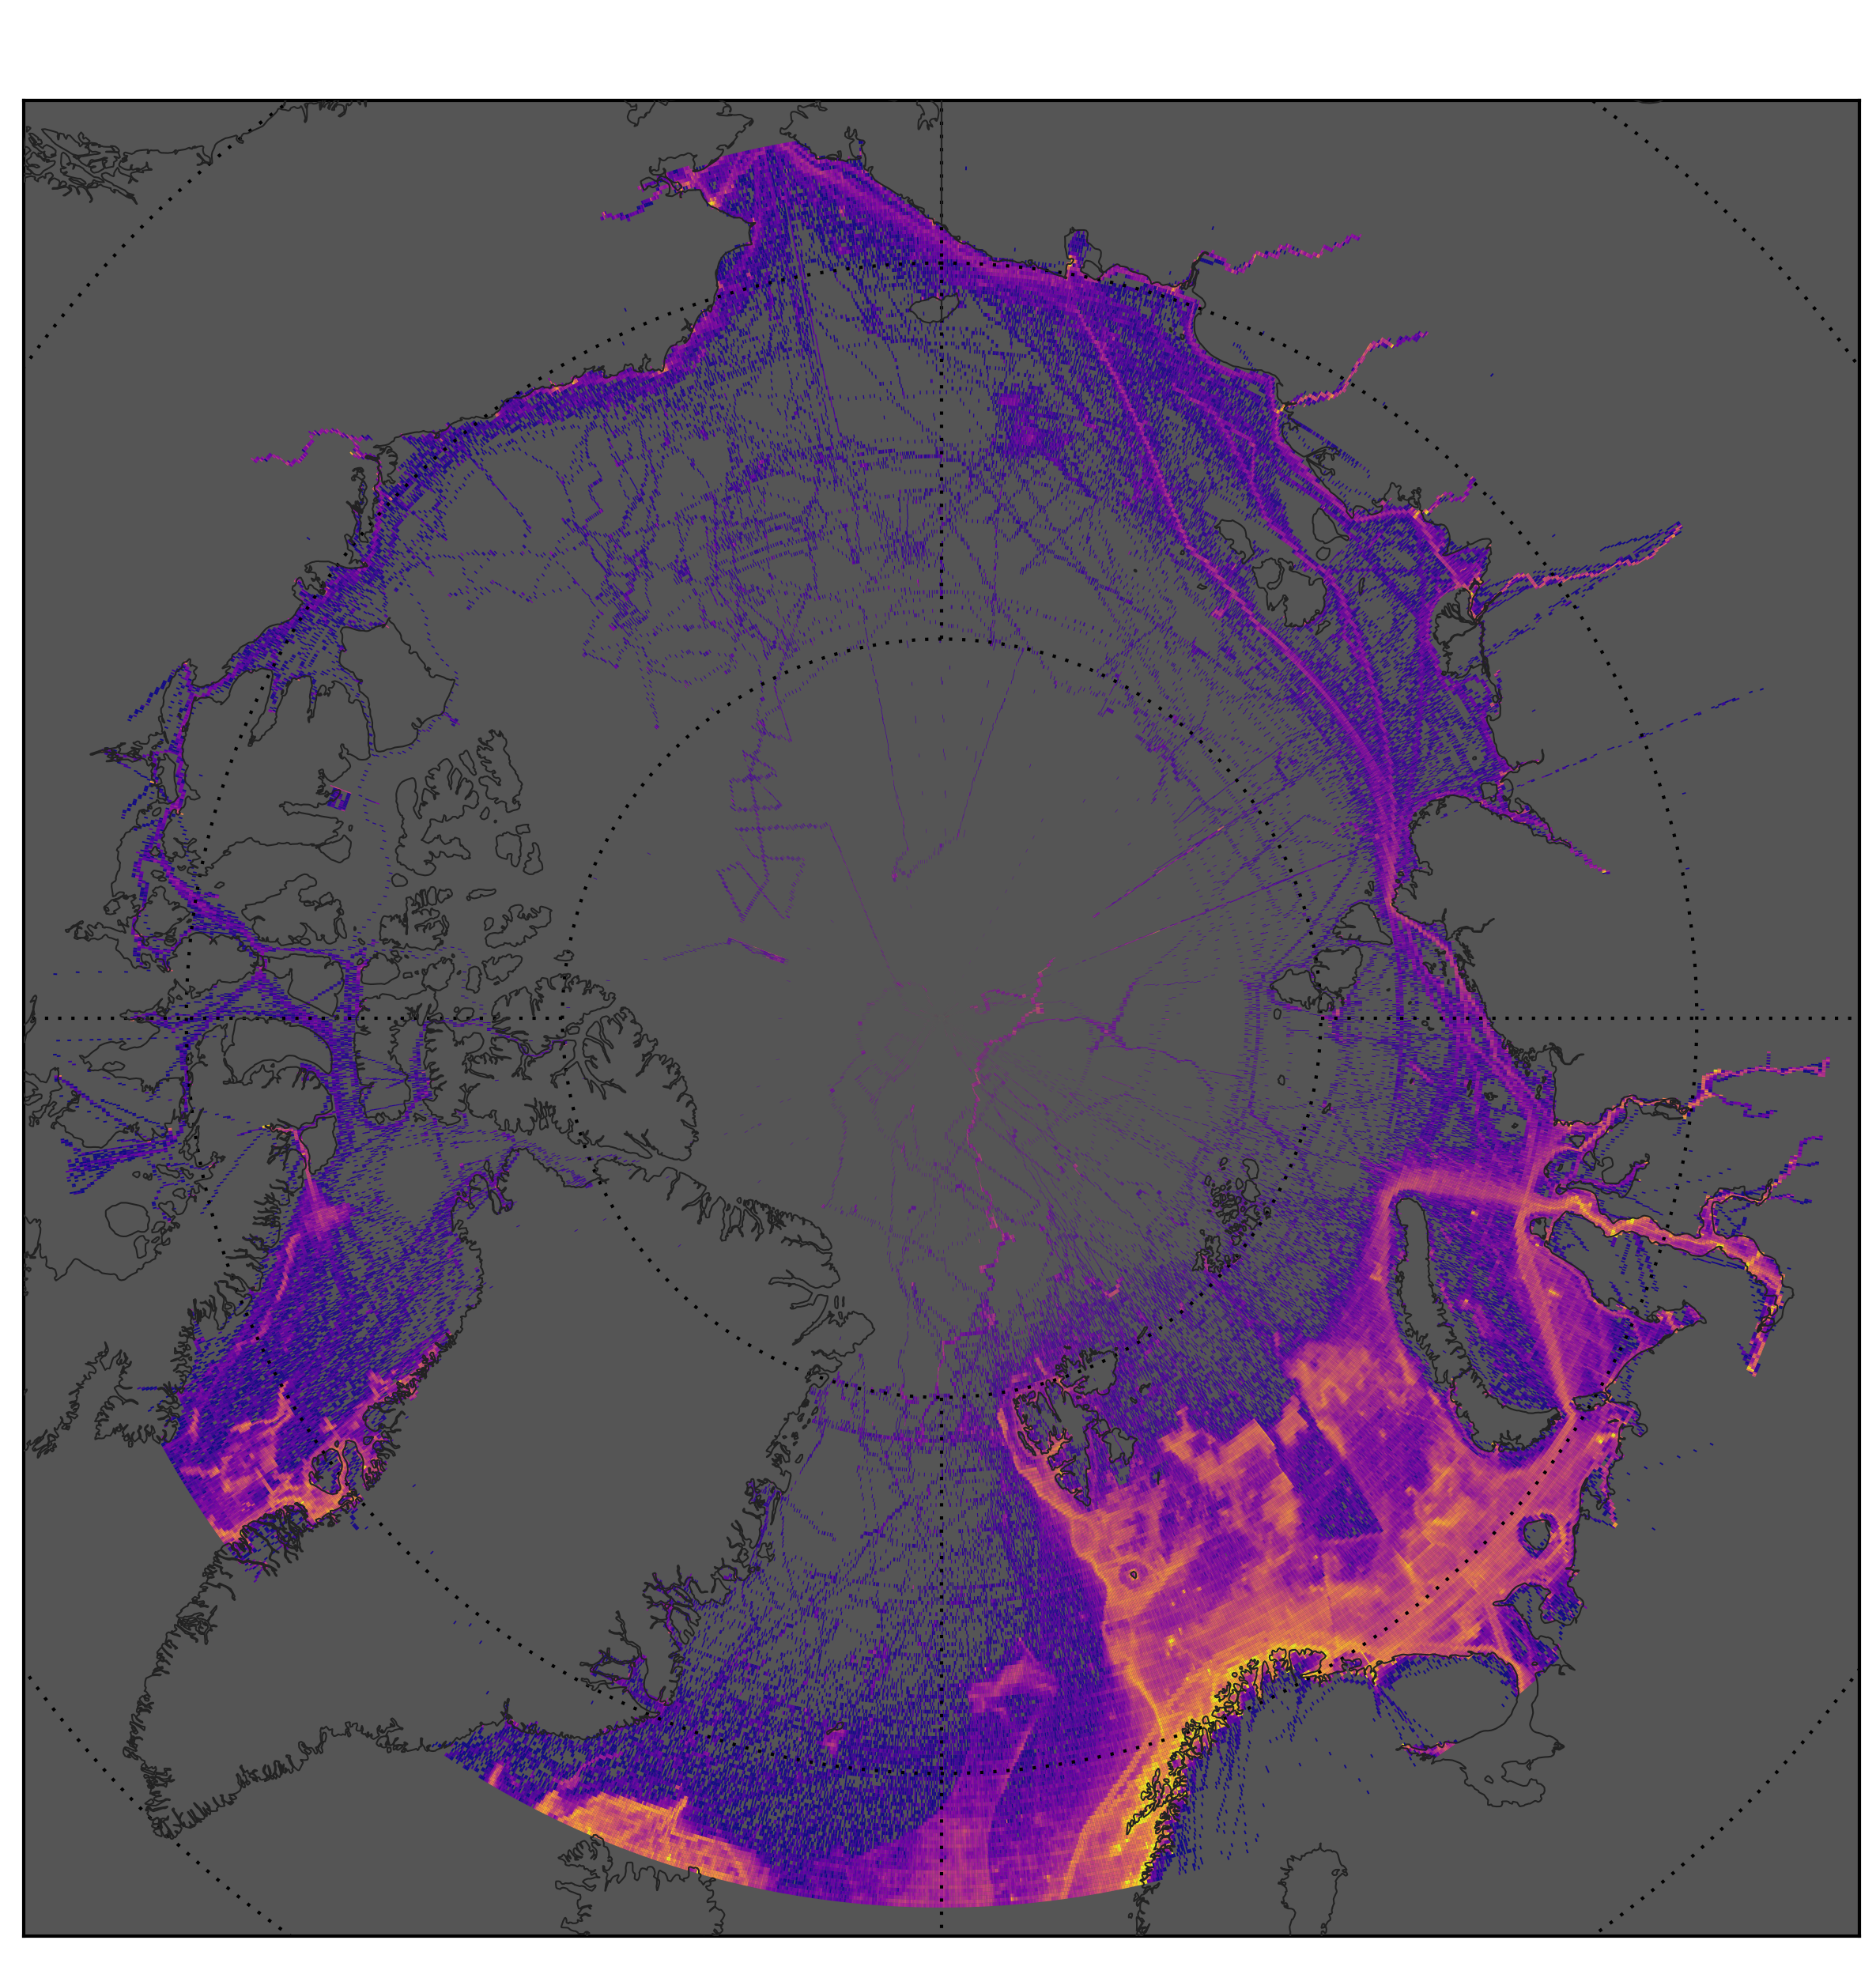
Shipping routes visualization
His study revealed that in the past, these shipping routes existed only in the summer, but now, they last for a longer time even until January.

Interview with Jorge Rodriguez
"The open data available on the platform can contribute to understanding how this traffic overlaps with marine animals and how these stressors may affect marine life,” said Rodriguez.
Comparing daily fish catch data from the fishery department with other ocean variables in the ODC

Håkon Vatne is a Data Engineer working for the IT-consultancy company Knowit in Bergen, and he is another of our testers.
“I have been very motivated to test the platform since 2020 when I first saw that it was being built”, said Håkon Vatne.
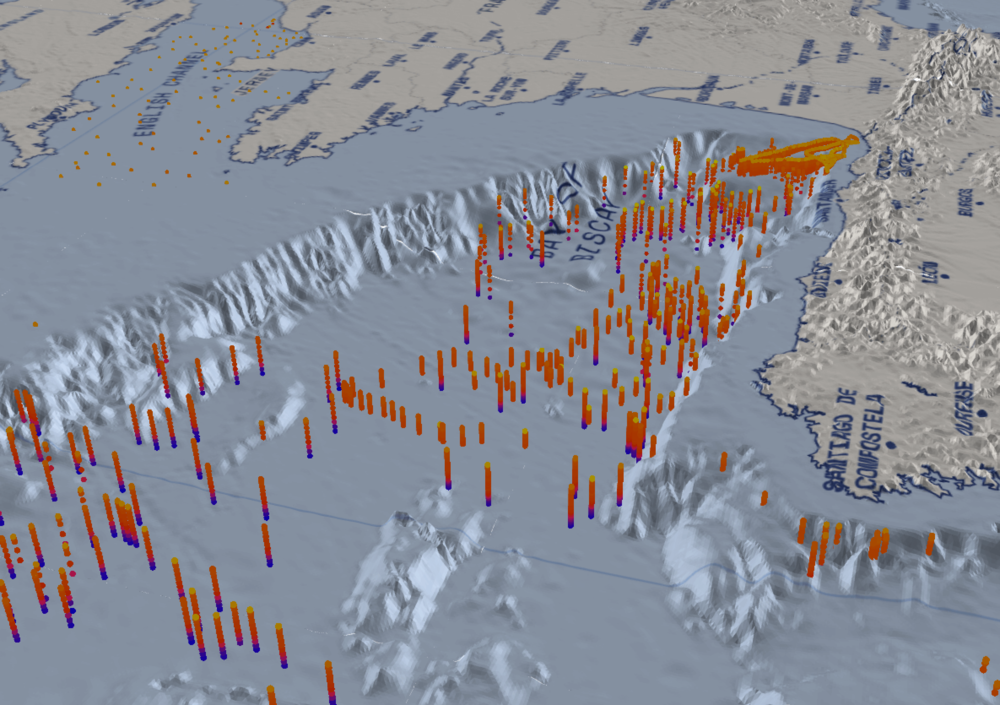
“During my testing, I worked on taking daily fish catches to compare that with other ocean variables in the Ocean Data Connector to understand fish migration and predict exact spots where fish can be easily caught. I was able to create a Python-notebook and visualizations to understand trends of places where fish was caught”, explained Håkon Vatne.

Visualization of mammal migratory routes, MPAs and Ship tracks
He also tested his theory on fuel emissions for vessels by looking at how many hours ships spend on the way. He saw the emissions data from fishing vessels, heat map over the years and the bathymetry data for the same areas.
“I’ve spent a great amount of time before and after my preview week working with ocean data from different sources. And I cannot express how much I welcome this platform,” said Håkon.

Jo Øvstaas
“It has been very instructive to go through this period of external testing and we have received a lot of constructive feedback regarding bugs/defects, usability and new functionality,” said Jo Øvstaas, Head of Platform.
Technical snacks
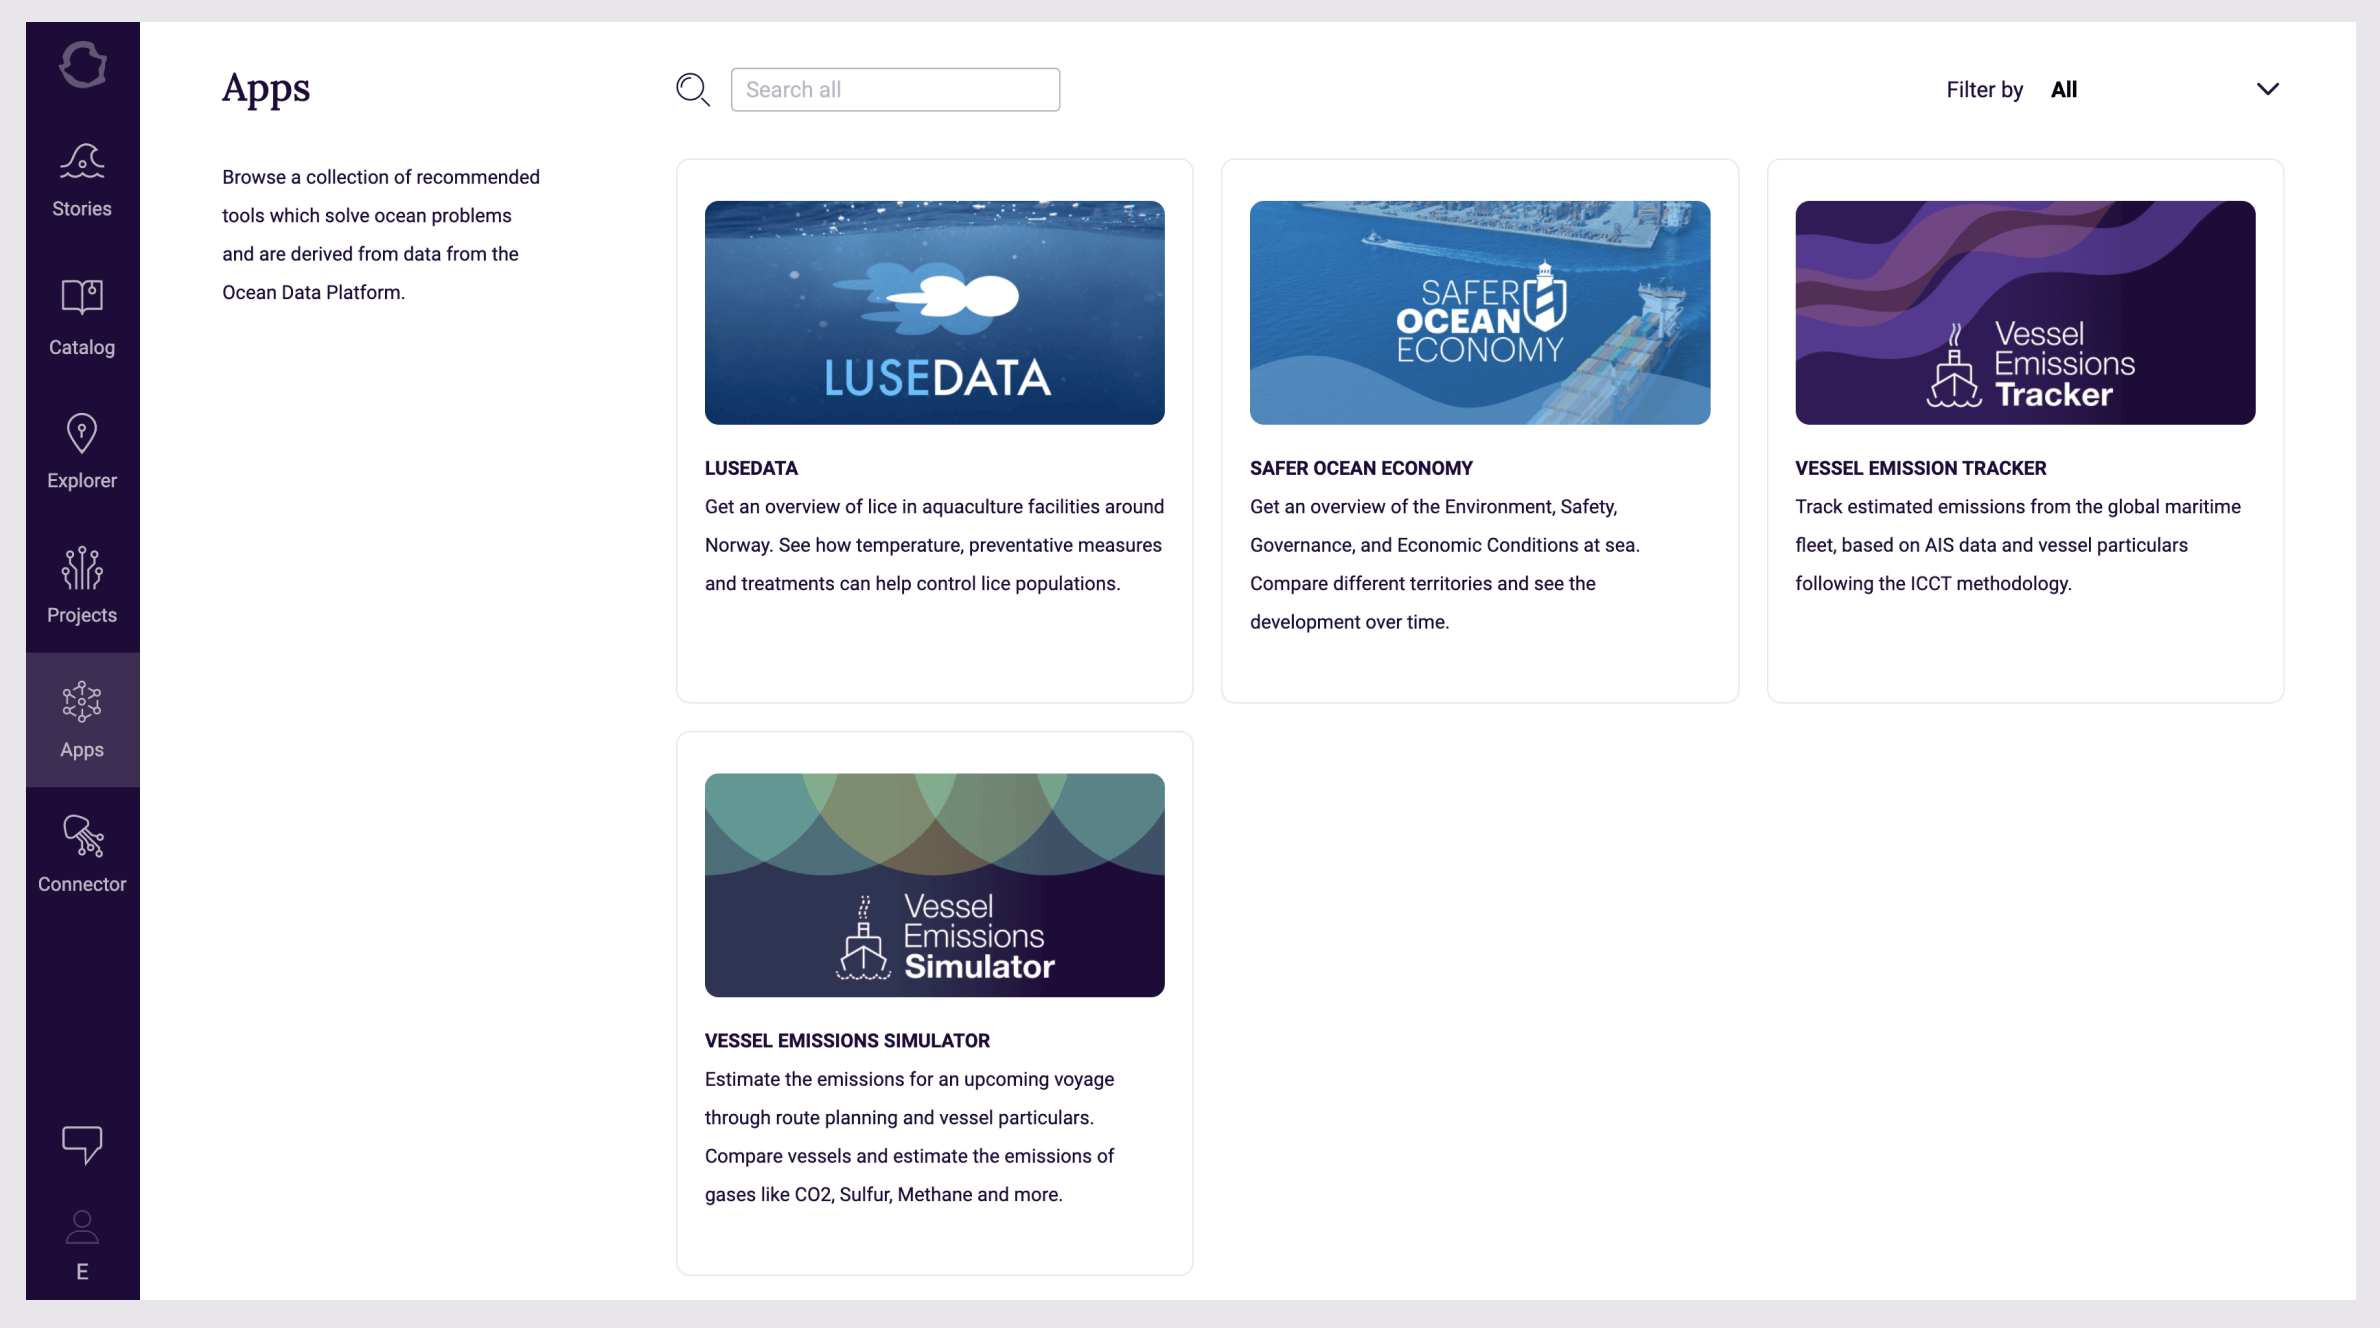
There are a number of common denominators in the feedback and these primarily concern the following:
A very user-friendly data catalogue that allows you to search across data domains (science, industry, management and socio-economic data) or from several dimensions, for example geospatial, time, depth, theme and more
Simple and scalable solution for uploading/downloading and sharing data in all shapes and forms
Possibility to bring computing power to the data (work with it directly in the cloud through your web browser) or download or stream data to your own infrastructure.
Great storage capabilities and ability to handle everything from proprietary/binary file formats to (big) tabular or gridded datasets.
Self-service capabilities for data ingest, consumption, computing or visualization.
Readable by humans, by web-based user interfaces and machines by APIs.
The entire product and data team is working hard on this, this autumn and we are looking forward to showing off new capabilities and having several more rounds of interaction, testing and feedback from our community.
“I am absolutely sure that we together with our great partner ecosystem will achieve something very good and partly unique to take data-driven ocean management into a new era”, said Jo Øvstaas.