
Want to show your ocean data where your audience already is? With the Ocean Data Platform (ODP), you can put a live, interactive map of any tabular dataset on your website or blog. It takes six steps and one copy-paste – no coding needed.
In this guide, we use a research cruise dataset from Conwy Bay, Wales, as an example.
Step 1. Open your dataset on the map
Bring your own data to the platform, or browse the catalog on the Ocean Data Platform (ODP).
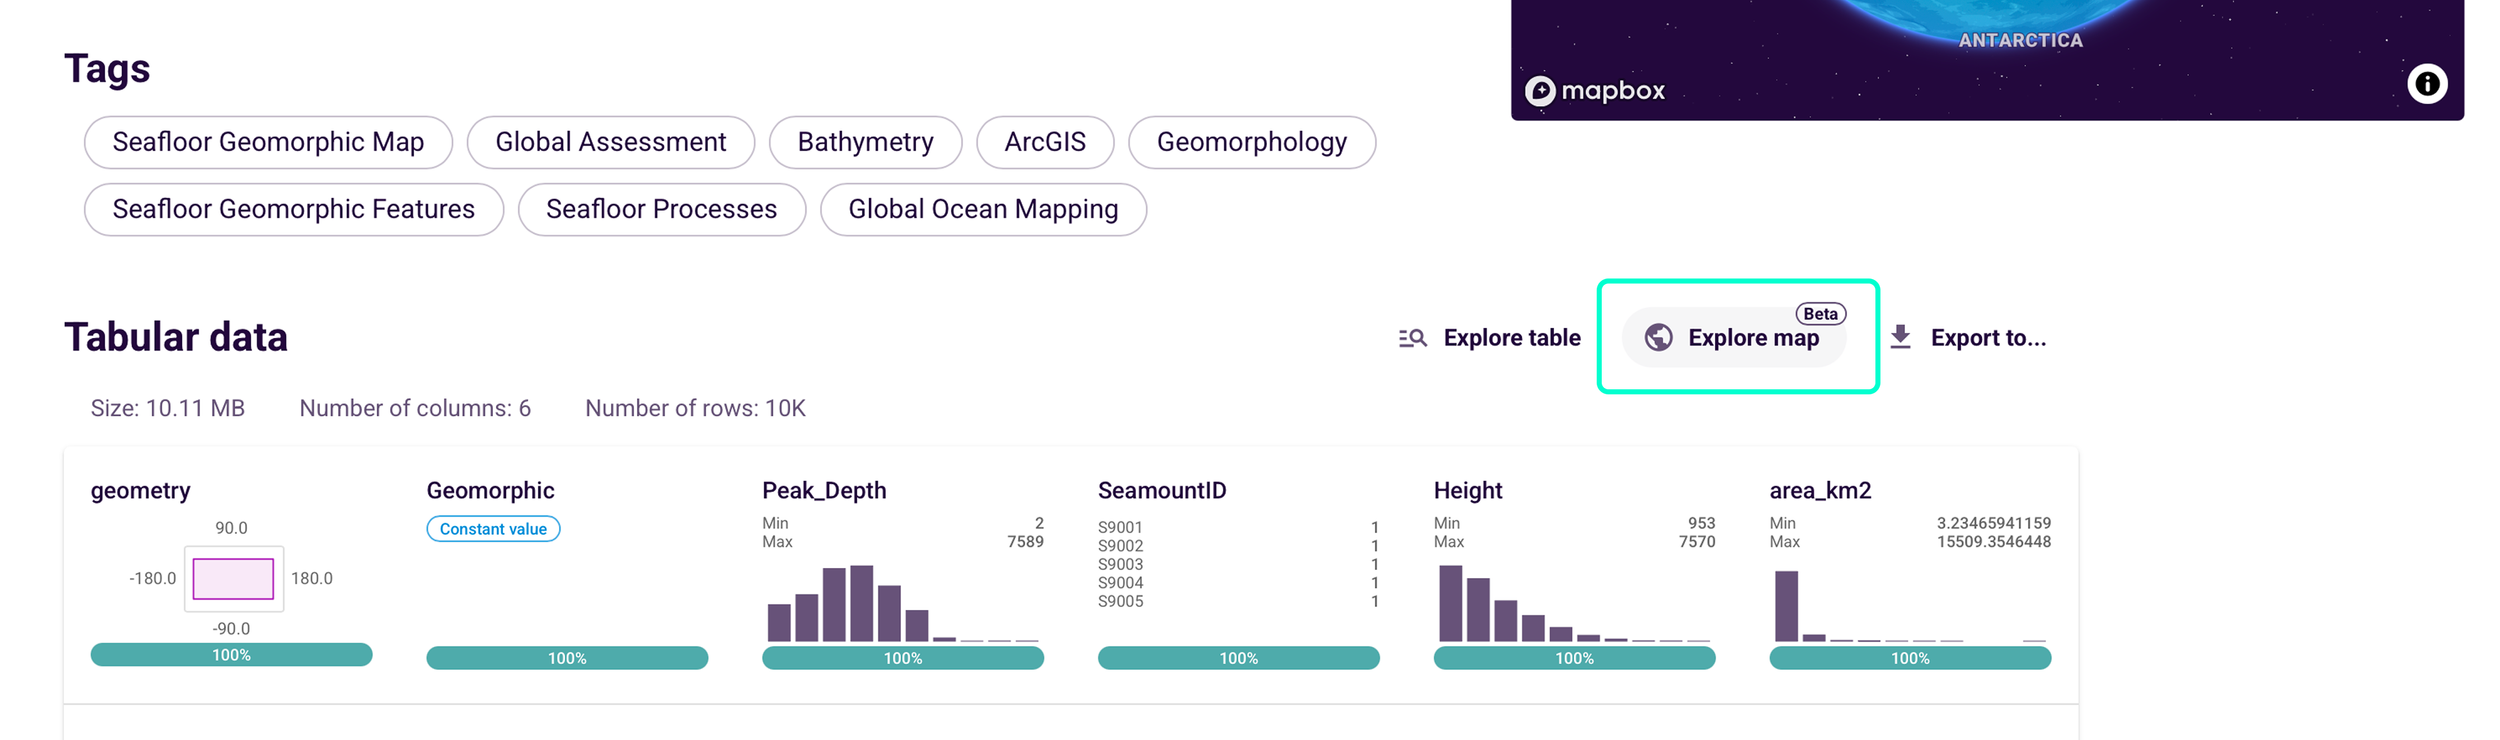
Go to the dataset page on the Ocean Data Platform. Scroll down to Tabular data and click Explore map (marked Beta). The data points now appear on an interactive map.
Step 2. Colour the points by a variable
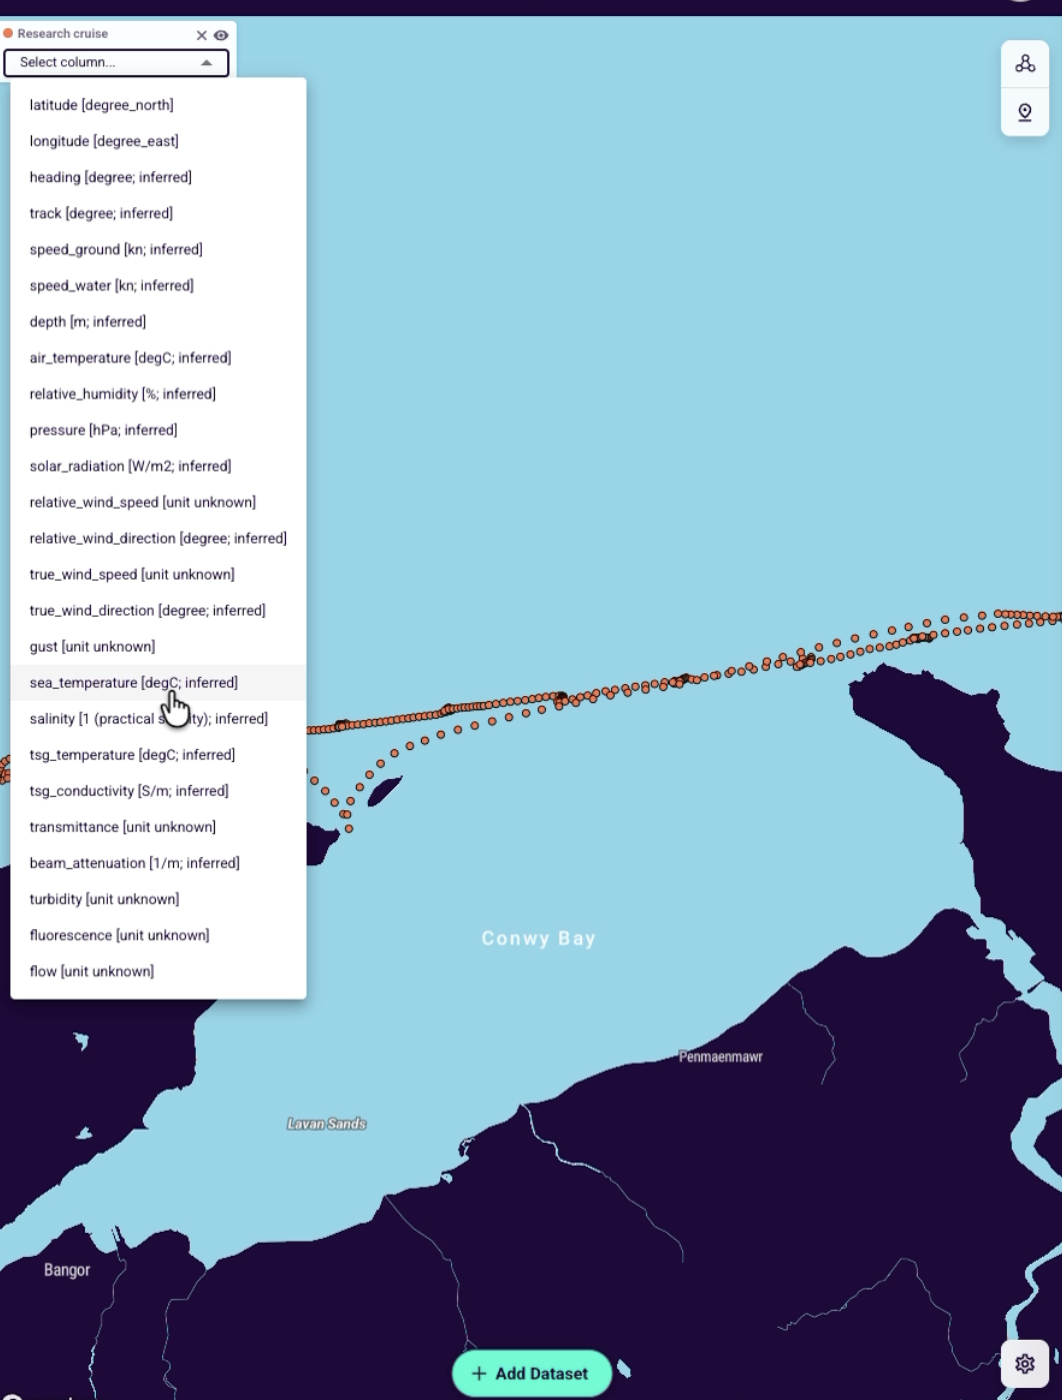
In the layer panel at the top left, open Select column and choose the variable you want to show. In our example, we picked sea_temperature. The points are coloured on a scale, and the legend shows the range (here 9.22 to 10.59 °C).
Step 3. Set up the view
The rule is simple: what you see is what you embed. The embedded map opens exactly as it looks on your screen when you copy the code: the same position, zoom and colours. Want to show a region? Zoom in on it. Want the global picture? Zoom out.
To change how the map looks, click the settings icon (the gear) in the bottom-right corner of the map.

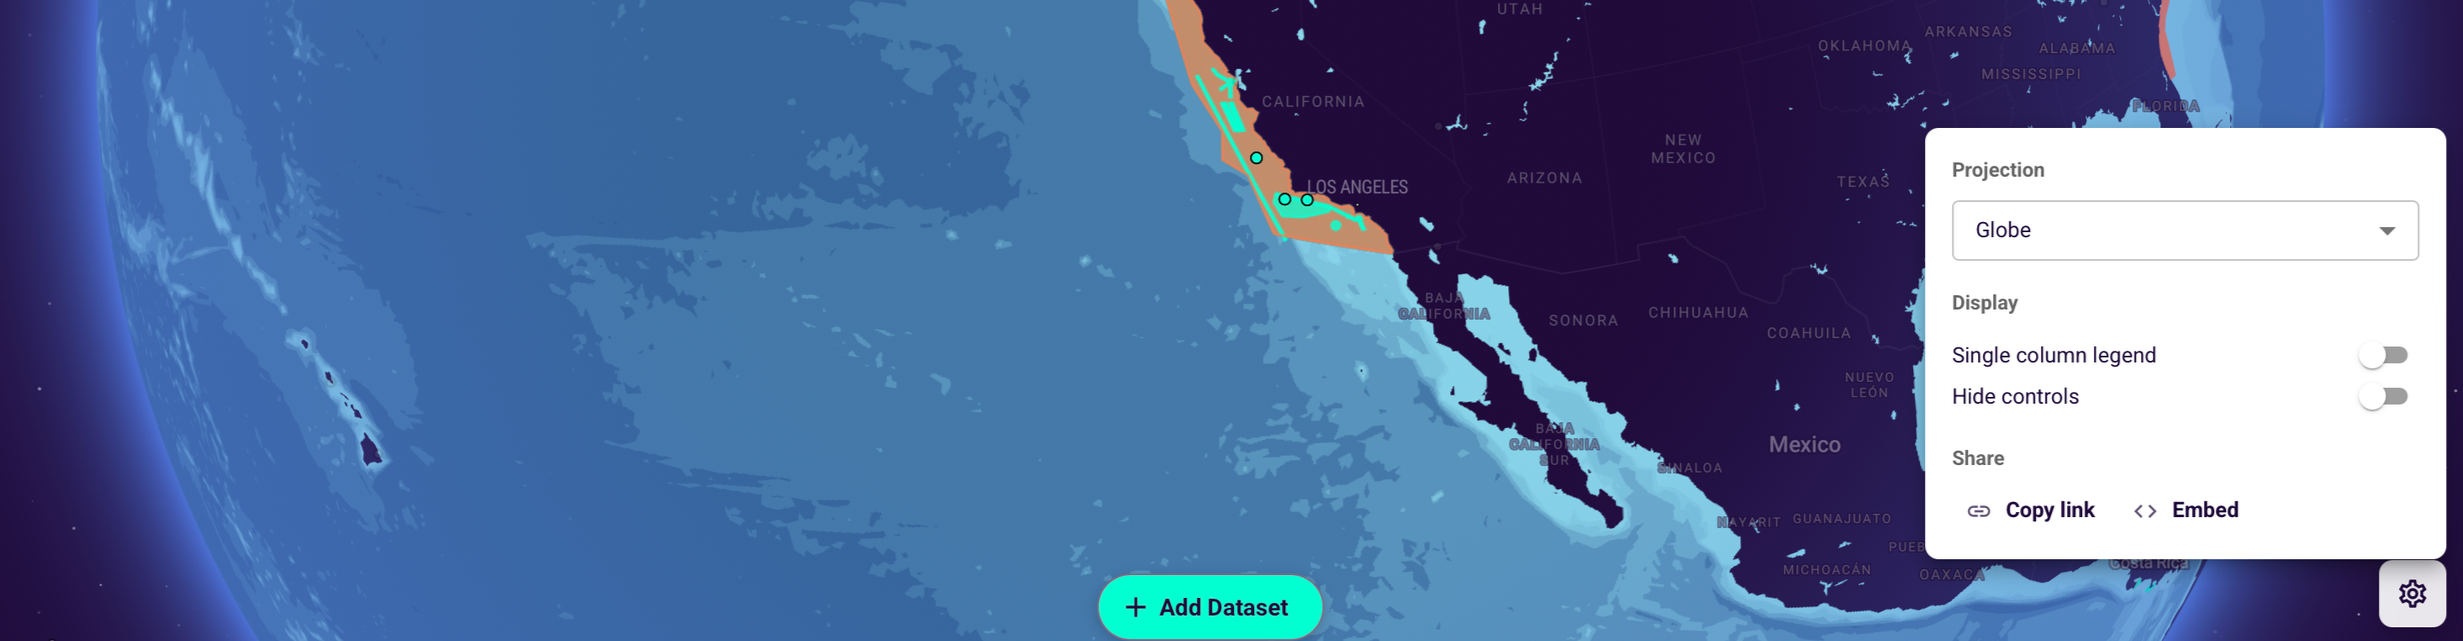
Projection
Projection changes how the round Earth is drawn on a flat screen. You will notice the difference most when you zoom out to the whole world. ODP offers three options: Globe, Mercator and Equal Earth.
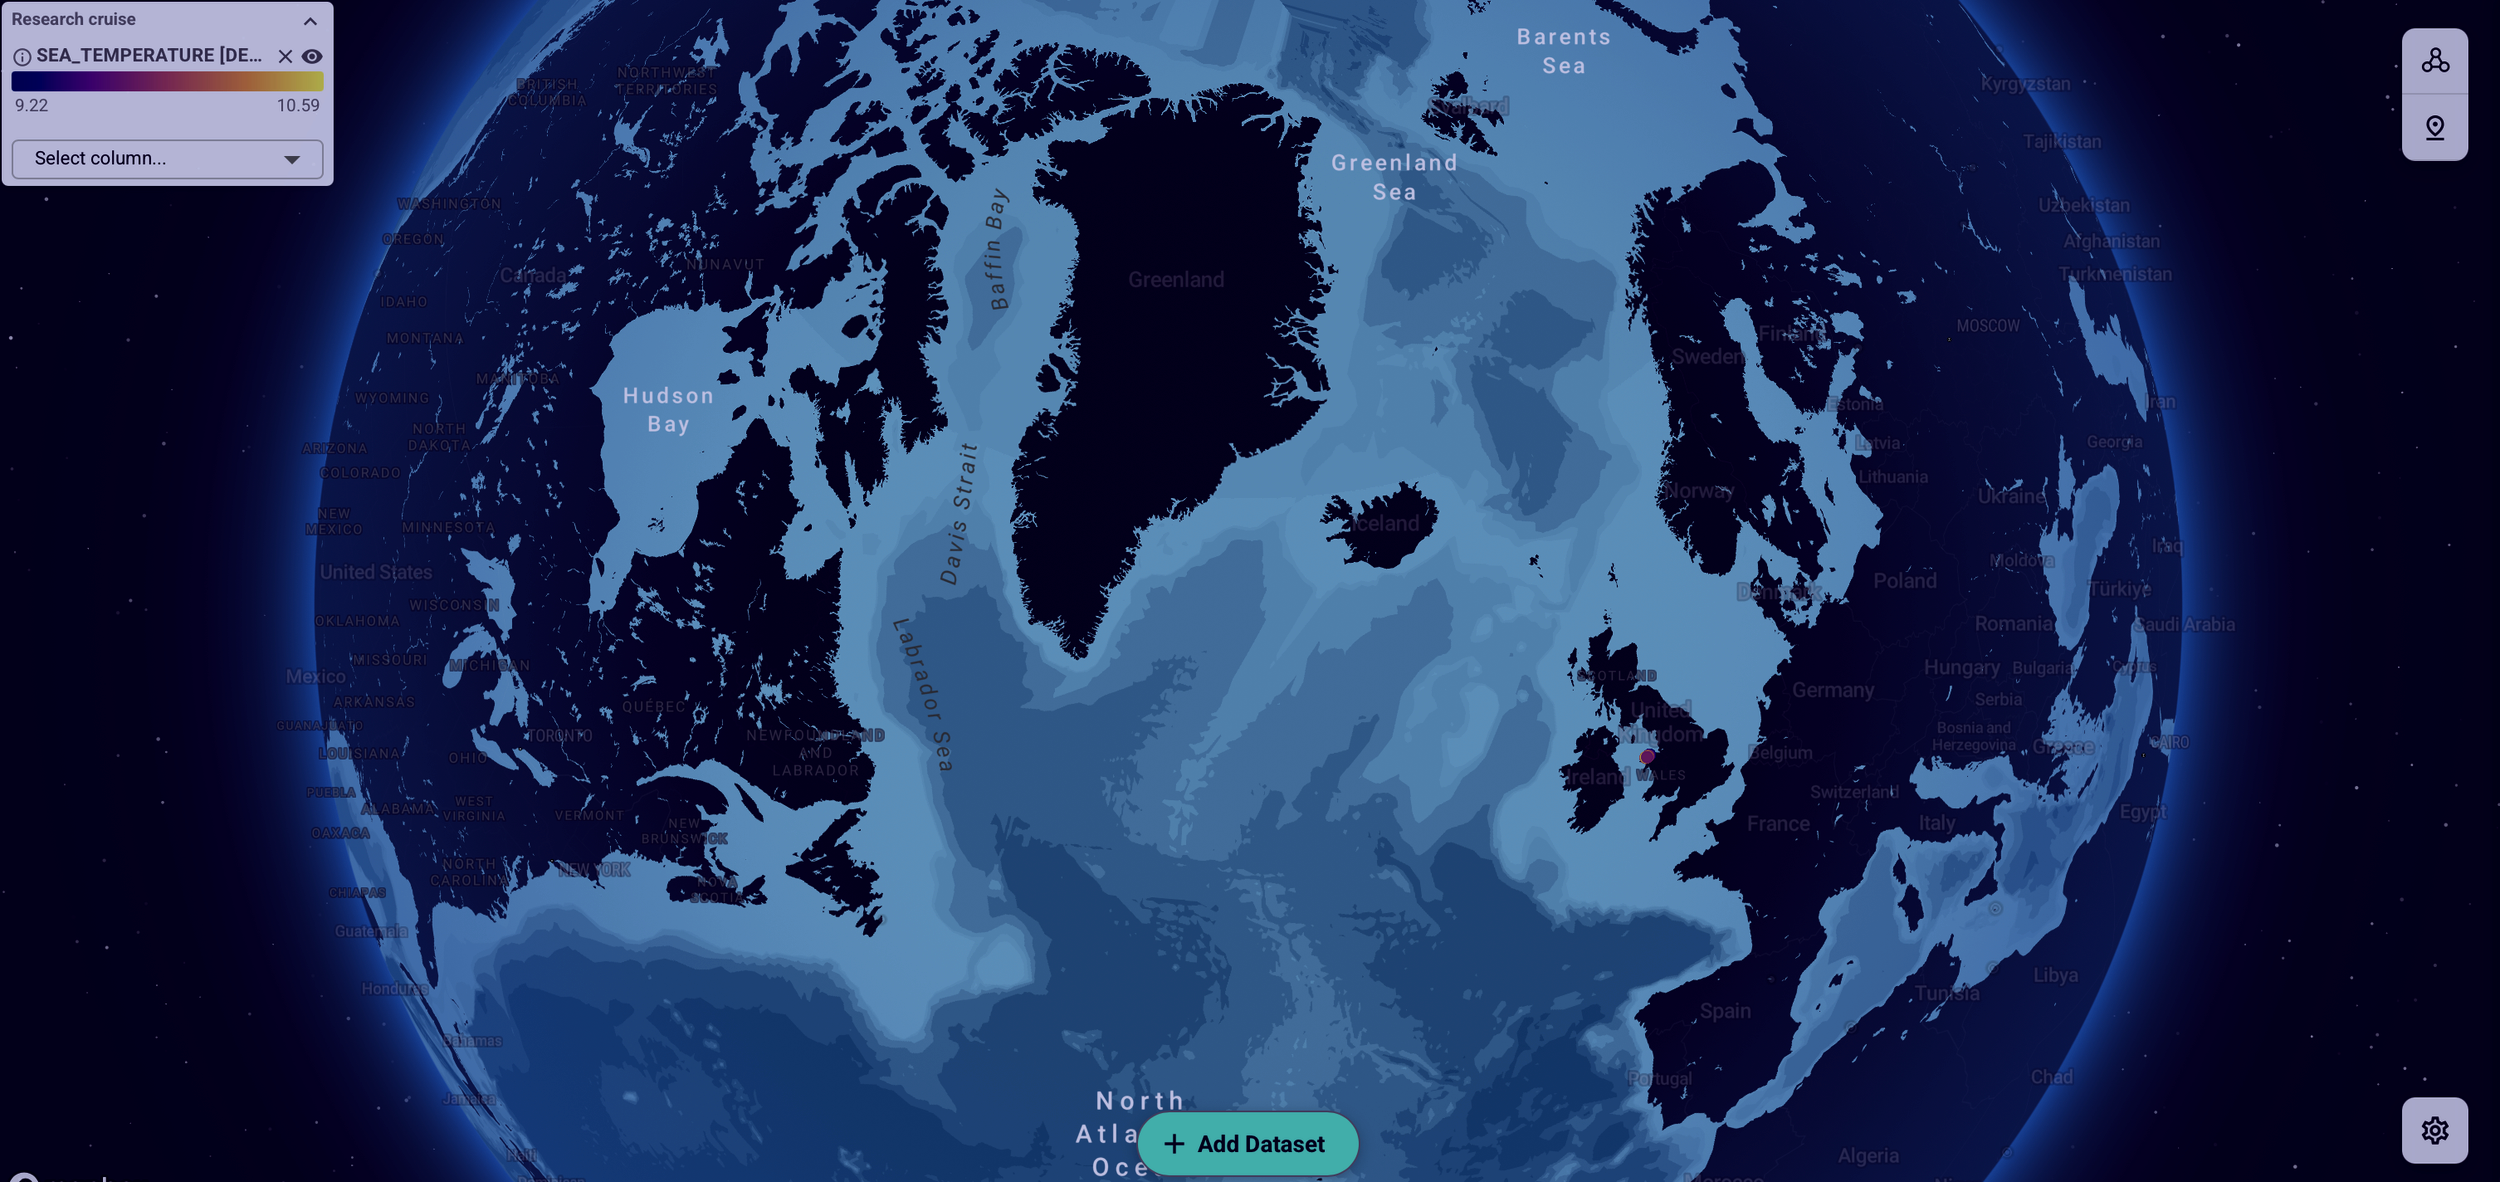
Globe (the default)
Shows the Earth as a 3D globe. You see one side of the planet at a time, with its natural curve.
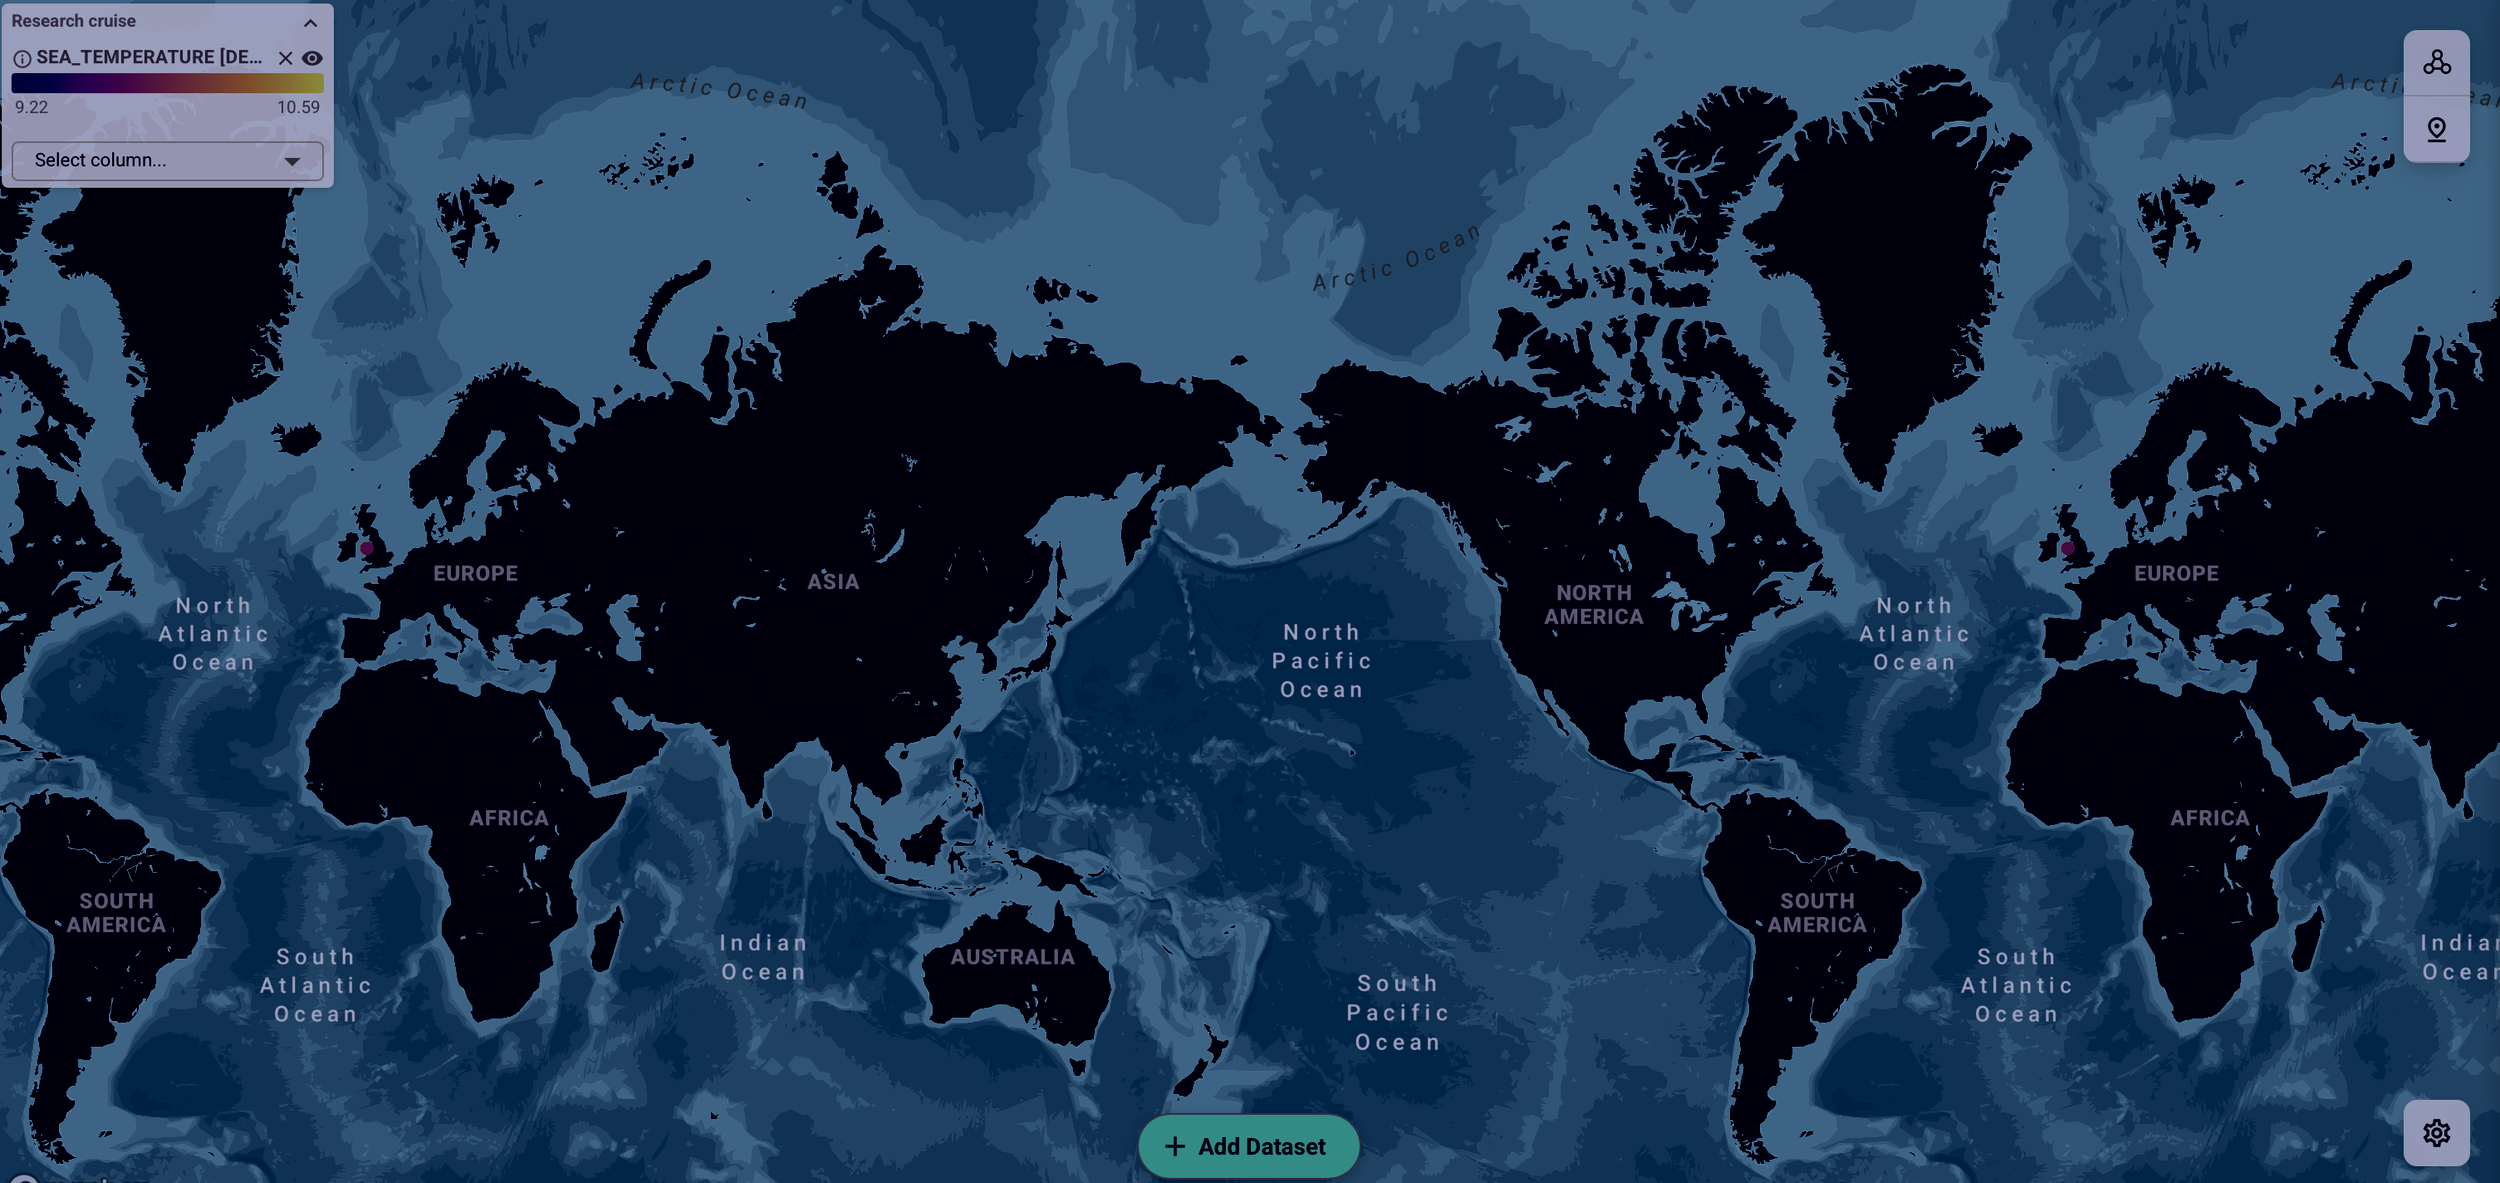
Mercator
The familiar flat web map. The whole world fits on the screen, but areas near the poles look much bigger than they really are – see how large Greenland looks.
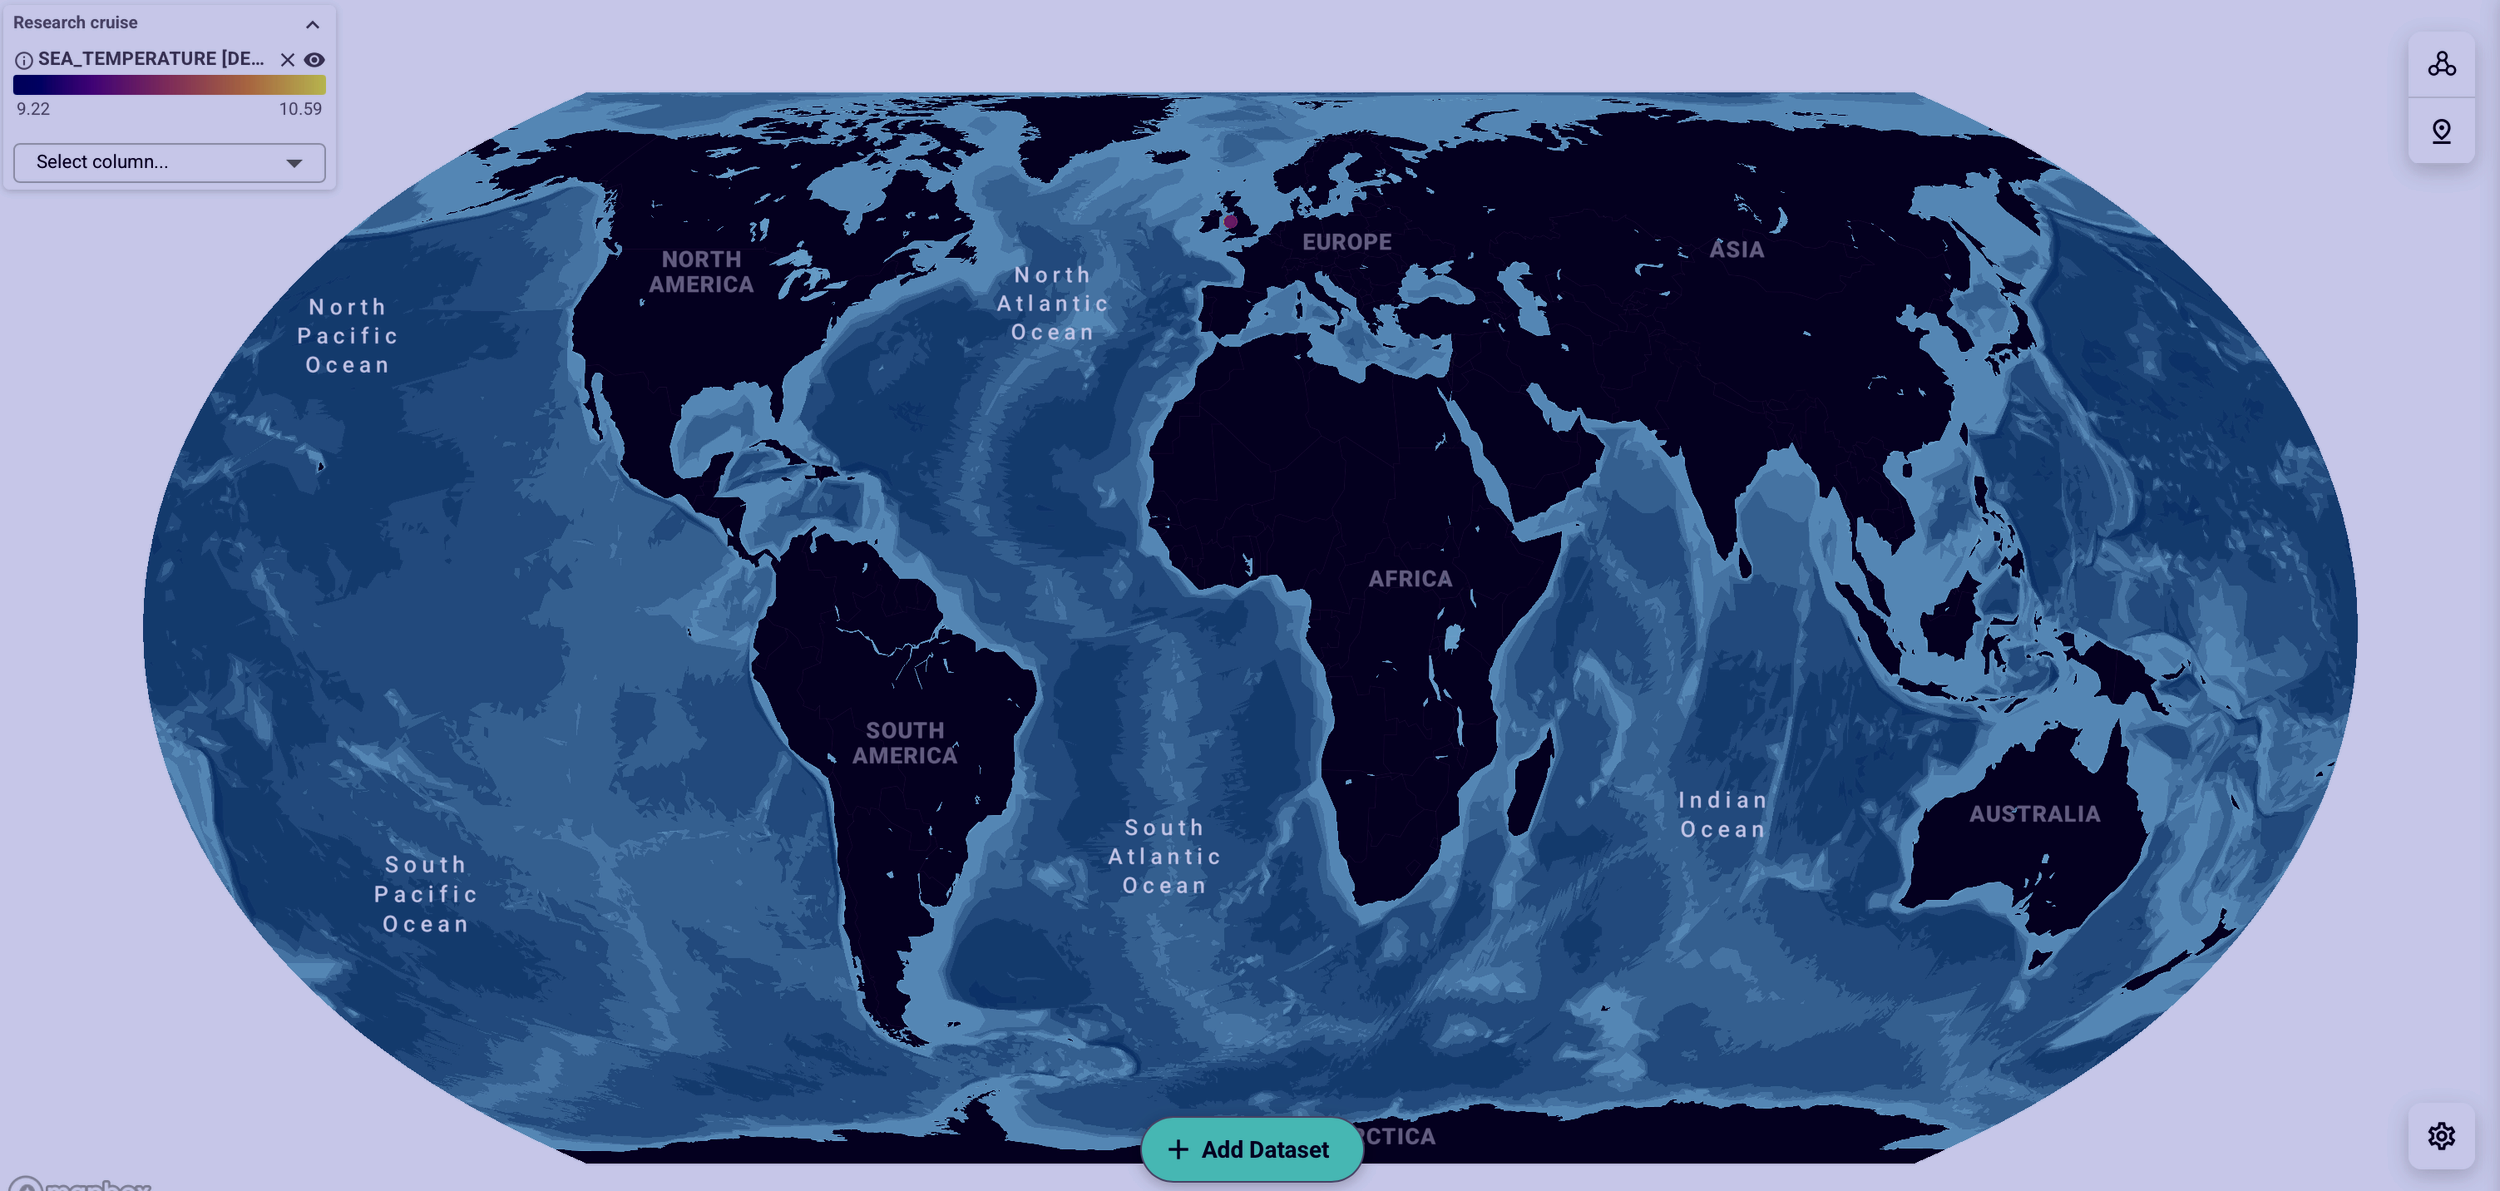
Equal Earth
A flat, oval-shaped map that keeps every area at its true size compared to the others. Use it to compare regions around the world fairly.
Display settings
Single column legend. If your map shows several datasets, their legends can take up a lot of space and cover part of the map. Turn this on to stack them neatly in one column.
Hide controls. Hides the buttons for changing the map, such as Select column and Add Dataset, so readers see a clean map with just the legend.
Step 4. Copy the embed code
In the same settings panel, under Share, click Embed. A “Copied to clipboard” message confirms the code is ready to paste.
Want to share the map without embedding it? Click Copy link instead and send the link.
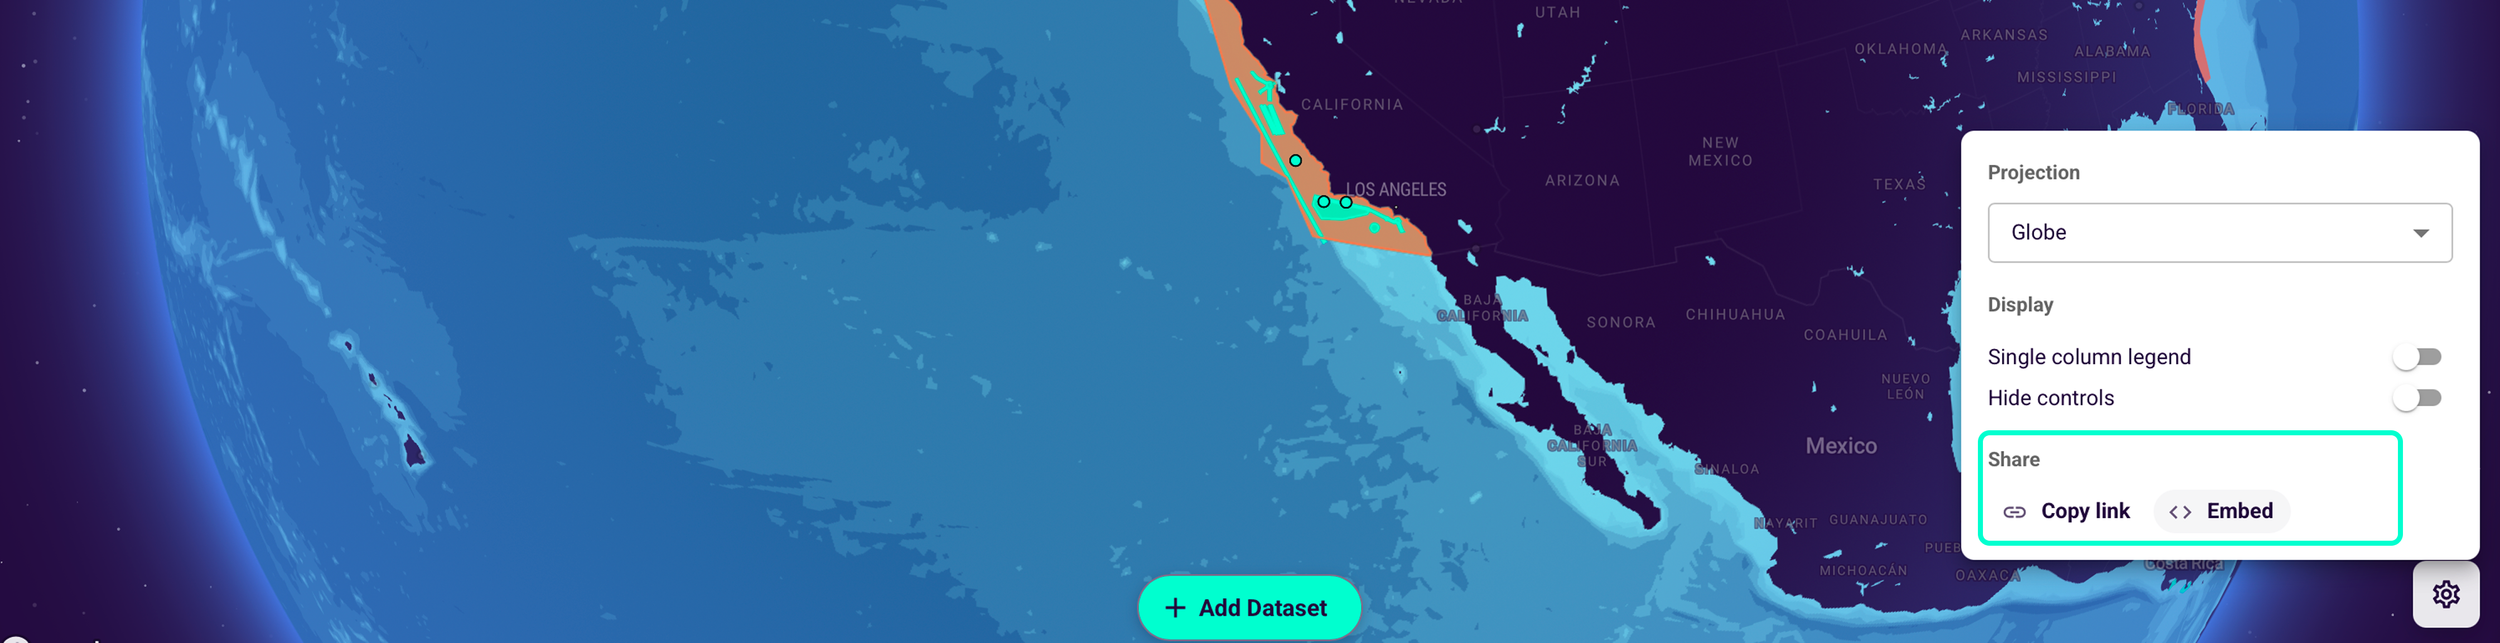
Step 5. Paste the code into your web page
Open the HTML of your website, blog post or page builder, and paste the code where you want the map to appear. The code is an iframe that loads the map from app.hubocean.earth. By default, it is 100% wide and 500 pixels high. You can change the height value to make the map taller or shorter.
If you use a website builder, look for an option to add custom code or an embed block.
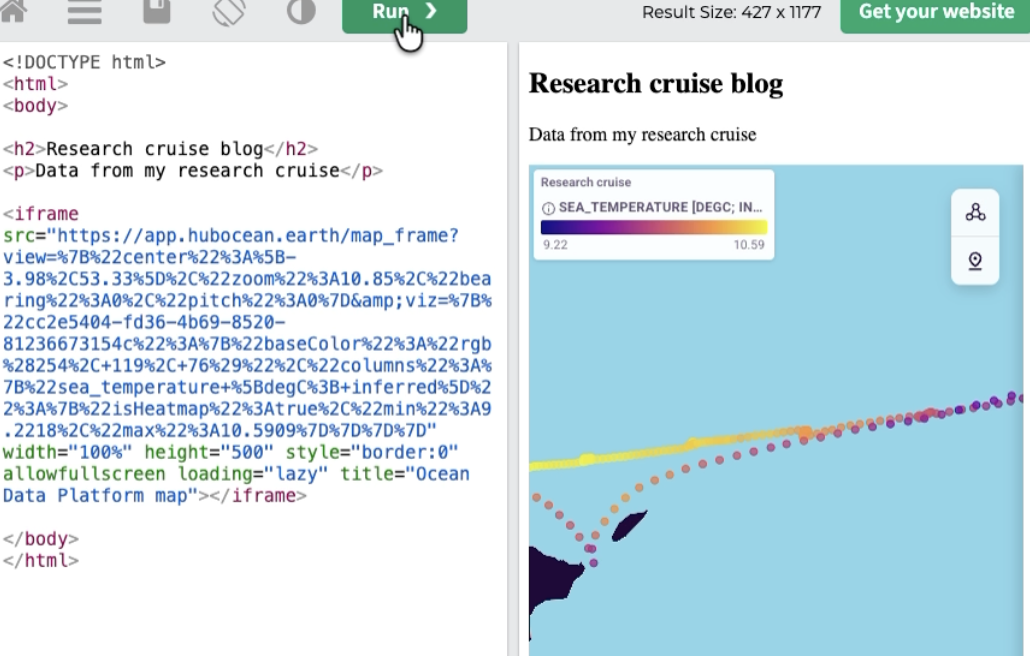
Step 6. Check the live map on your page
Save or preview your page. The map loads with the same view and colours you set in ODP. Your visitors can:
move around the map and zoom
click a point to see all its values, such as time, position, air temperature and pressure
Good to know
The map stays fully interactive on your website or app. When visitors open it on the Ocean Data Platform, they will only see the map you built, not the data in any other format.
Explore map is a Beta feature, so buttons and labels may change.
Ready to try it? Open the Ocean Data Platform and embed your first map.